
100% availability with less than half the inventory
Puneet Kulraj

When the customer’s tolerance time is much lesser than the supply lead time (from production to retail shops), it is imperative to have stocks at the point of sale. Not having availability when the customer comes to buy at the store/ shop leads to lost sales. As the retailers does not want to lose the customer, he will actively sell ‘other’ brands, and if the customer’s experience with the ‘other’ brand is satisfactory, it may lead to a long-term loss of sales for the consumer goods company. Usually, customers want to justify their purchase and can actively market the ‘other’, brand leading to further loss of sales. Hence even infrequent stockouts at the shops can lead to a significant loss of sales.
Many salespeople believe that having a huge inventory at the point of sales or at the distributors can avoid unavailability. As a matter of fact, in cases where many SKUs are to be managed, high inventory at distributors and retailers leads to unavailability. A contradiction? Combining the facts that sales forecasts are not accurate as we move towards the retail end and that sales push available stocks (to meet sales targets), the inventory at the distributor and retailer, though high, is mismatched. Consequently, the limited cash of these trading partners is mostly stuck in SKUs that will not sell immediately, while those selling immediately are stocked out. Either the distributor waits for cash to be unlocked, or the company does not supply due to credit limits. In both cases, the unavailability is ‘created’ though the consumer goods company has enough stocks in its warehouses.
Additionally, the introduction of new items or promos can be delayed due to high stocks in the pipeline. Having high stocks is not favoured by the finance people, as it leads to increase in costs (warehouse space, carrying costs, damages, write-offs, etc.) and requirement of more than desirable capital. Most consumer goods companies would have more than four months of stock in the pipeline from plant to the retailers. This stock in the pipeline is the company’s liability, as further sales of the company are restricted by this stock in the pipeline.
To summarise, to protect sales, i.e., avoid unavailability, the company needs to have high stocks, while to control costs the company needs lower stocks. But both ‘control costs‘ and ‘protect sales‘ are critical for profitable growth.
Management frequently swings between the two actions (high inventory and low inventory) depending on the pressure on the critical needs – protect sales or control costs. In many consumer goods companies, this is the way to manage the situation.
Many would consider this situation very complex. In the Theory of Constraints, no system is considered complex. If the cause and effect linkages of all entities in the system are understood, then the system becomes simple. Once the cause and effect linkages are known, the solution is usually very simple.
Direction of Solution:
Obviously, keeping high inventories is not a favoured direction due to the damages it generates in terms of inventory carrying costs, capital locked and unavailability. Distribution and Sales want higher inventories to protect sales because they believe that forecasts are inaccurate, replenishment times are too long, and supply is unreliable. Usually, companies try to address this situation by seeking a tool to have more accurate forecasts. Also, managers believe that they cannot reduce the lead times drastically and improve supply reliability without additional investment (additional warehouses and inventory) and a huge effort in the company (as it involves many departments).
As it is impossible to have accurate forecasts (one cannot control or predict external factors such as competition activity, weather, supply unreliability, etc.), we will not try to improve it. Instead, we will try to reduce replenishment lead times and supply reliability of while releasing investment (reducing inventory). The Theory of Constraints thinking provides the necessary solutions.
Elements of the Solution:
If the replenishment of the next stocking point (regional warehouse, distributors, retailers) is based only what is sold, the stocking point can have near 100% availability. But if the initial inventory of the SKUs at the stocking points is inadequate (to cater to any demand in the supply lead time), then this replenishment cannot guarantee 100% availability at this stocking point.
As forecasts are never accurate and demands fluctuate, there is no point in undertaking extensive research to determine the correct inventory levels for each SKU at each stocking point. If a reliable mechanism exists to change stock levels according to the trends in demands or changes in supply conditions, then a good enough starting stock is sufficient. This good enough stock level is determined by:
- Good enough starting stock level at a stocking point = Average dispatch (or sales) per day x Total Replenishment Time (TRT) x A factor of safety (to account for variability in demand and supply)
- TRT is the time taken from the time of sale of the SKU till it is refilled at the point of sale.
Consider the case of a regional warehouse (which could be a regional Carrying and Forwarding Agent). By the above formula, the inventory to be carried would be very high – in the range of over 45 days - to have high availability, as the TRT is over 40 days. Due to the monthly planning horizon and that the plants produce in large batches (trying to achieve the highest efficiency and utilization), the SKUs are generally produced 2-3 times a month. So, a regional warehouse could receive material 2-3 times a month. So, from the time the monthly order is placed till the material is received, the time elapsed is over 30 days. Add to this extra inventory to account for variability in demand and supply reliability; the safe inventory will be over 45 days.
Using TRT of 45 days does not reduce inventory. As average demand is an external factor, the only parameter to be reduced is to have lower inventories is TRT.
The key to reducing TRT is to understand its composition. TRT is made up of:
- Order Lead Time (OLT) - time taken to place the next order an SKU since the last sale
- Production Lead Time (PLT) - time taken for manufacturing a product.
- Transportation Lead Time (TLT) which accounts for actual transportation time and the time for waiting for full truck batches.
OLT:
Interestingly, if regional warehouses or distributors place orders once a month for an SKU, the OLT is 30 days. The graph below illustrates the inventory level of the regional warehouse ordering once a month from the plant. This is also the case of a distributor ordering directly from the plant.

If the regional warehouse orders every day, the OLT will be reduced to one day - a huge reduction! With today’s IT technology capabilities, this data can be easily transferred to the earlier delivery point.
PLT:
If the supplies to the regional warehouse take place from a plant warehouse that has 100% availability, the production lead time (PLT) can be eliminated from TRT.
TLT:
If the plant warehouse receives daily sales data from the regional warehouse and has near 100% availability of all SKUs, then it can fill up trucks with an assortment of SKUs for a full load, rather than, as in the existing system with no plant warehouse, wait for the large batch to be produced. This system of daily replenishment increases the frequency of trucks leaving the plant warehouse (and not the number of trucks), thus reducing the TLT by more than half.
To summarize the TRT reduction:
The OLT is reduced to one day from about 30 days, PLT is reduced to zero from the normal 15-30 days, and TLT is reduced to less than half. The effect of these reductions on the inventory levels and availability is illustrated below in blue -

The safe inventory to be kept at the stocking points reduces to about 10-15 days from the 45 days earlier.
But the concern with the above solution is that the addition of the plant warehouse, which did not exist before and is supposed to maintain 100% availability to cater to the demand of the whole country, will increase the inventory in the distribution pipeline substantially. Currently, the plant supplies directly to the regional warehouses.
Not so! The inventory to be maintained at the central warehouse/plant warehouse = average demand per day on it x production lead time x factor for unreliability of the plant. The plant warehouse (or central warehouse) is an aggregation point where statistical fluctuations even out. Not all regional warehouses will have peak demands at the same time. By principle of aggregation, maintaining half the average demand of all the regional warehouses at the central warehouse is sufficient to guarantee availability. TOC solutions reduce production lead times by half. So, for the plant warehouse, we have reduced per day demand by nearly half and production lead time is also reduced by half, ensuring that the inventory required at the plant warehouse is not more than 15 days. Incidentally, having a plant warehouse decouples the plant from the fluctuations of demand in the market, thus reducing emergency orders on the plant, further reducing the production lead time and the unreliability. Hence the factor to account for unreliability is also low.
Accounting for the already reduced inventory at the regional warehouses (15 days!) and the reduced requirement at the plant warehouse, the total inventory in the system up to the regional warehouses, in spite of the addition of a central warehouse, has reduced from 45 - 60 days to 30 days.
Usually, most distributors are just 1-2 days away from the regional warehouses. With the model described above, they can have near 100% availability of the full range with inventory of about 10-15 days. Their inventory turns will increase to 24 from the earlier 6. For a distributor with 4% margin, this will mean a Return on Capital Invested of over 50%! (Currently they have to be satisfied with about 12-16%).
This is all fine, but then demand is influenced by many external factors such as competitive activity or inactivity, seasons, festivals, events, etc., and can change significantly. In such cases, the original stock levels will be insufficient to cater to the growing demand. What can one do in such a scenario?
The Buffer Management system of the Theory of Constraints manages these changes effectively.
Buffer Management System:
The initial stock level is designated into three colors - red, yellow and green, for each 33% band. Stock at a level lower than 66% of the designated stock level will be in red.

With an increasing demand trend, the stock level will continuously be in the red as the supply is insufficient to cater to the rising demand. If the stock remains in red for a period of time equal to the replenishment time to that stocking point, the stock level is changed by 33% i.e., one colour band. Any further change in stock level is carried out only after observing the stock levels after the additional (33%) material has arrived at the stocking point. Similarly, for a decreasing demand trend, the stock level is reduced by 33% if the stock is always in green. For steep changes in demand - such as an event (Diwali), or a season (air conditioners) - the levels will have to be changed manually, and later managed by Buffer Management during the season. As the supply is only according to what is sold in the next stocking point (distributor or retailer), and buffer management manages the upward and downward demand trends effectively, there is obviously no need for a short-term forecast! Long term forecasts are required to manage only the long lead time raw materials, such as imports.
The model described above provides near 100% availability at all stocking points while reducing the inventory in the system to nearly half. The improved availability increases the sales, while the distributors and retailers experience a significant increase in ROI. A WIN-WIN for all partners in the chain.
So the magic mantra: Stop forecasting, hold back inventory rather than pushing down the chain, and supply according to consumption.
This comprehensive solution, with all its elements has been implemented in quite a few distribution companies (companies in consumer goods, auto parts, fashion goods, etc.) in India by Vector Consulting Group’s consulting services
The results – are more than 30% sales growth at half the inventory levels, in a year.
Industry Insights

Managing distribution chain: Is there a better way than gazing the crystal ball?
Find out how companies can get the right material to the right place and ensure availability

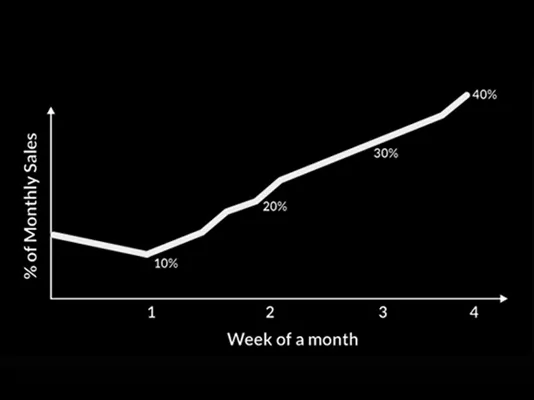
Straightening the hockey stick in sales and distribution
Read about how to break the omnipresent month end skew and release capacity

Who creates slow movers?
Read about how can companies convert slow-movers into a fast-mover
Get in touch
Vector Management Consulting Pvt. Ltd.
10th floor, Thane One, DIL Complex,
Ghodbunder Road, Majiwada,
Thane (West), Maharashtra - 400610, India.